Deep Dive: Understanding performance issues in TM1 visually
In-depth video and blog post showing how to analyse and understand performance issues in TM1 with the help of Cubeac. Read further for an explanation of what can cause locks in TM1 and what are some of the possible remedies.
While performance problems take many forms, there is one key indicator: when you get a call from your users.
Users are the starting point of Cubeac’s related dashboard - TM1 Users and System Response Time.
Before going into details it’s worth to note that this information also helps to identify the source of ‘TM1 frozen’ issues: the information presented in the dashboard is from the TM1 Server, thus if a user had her application freeze but TM1 was doing fine it must be another component in the chain like Citrix, Excel or TM1Web.
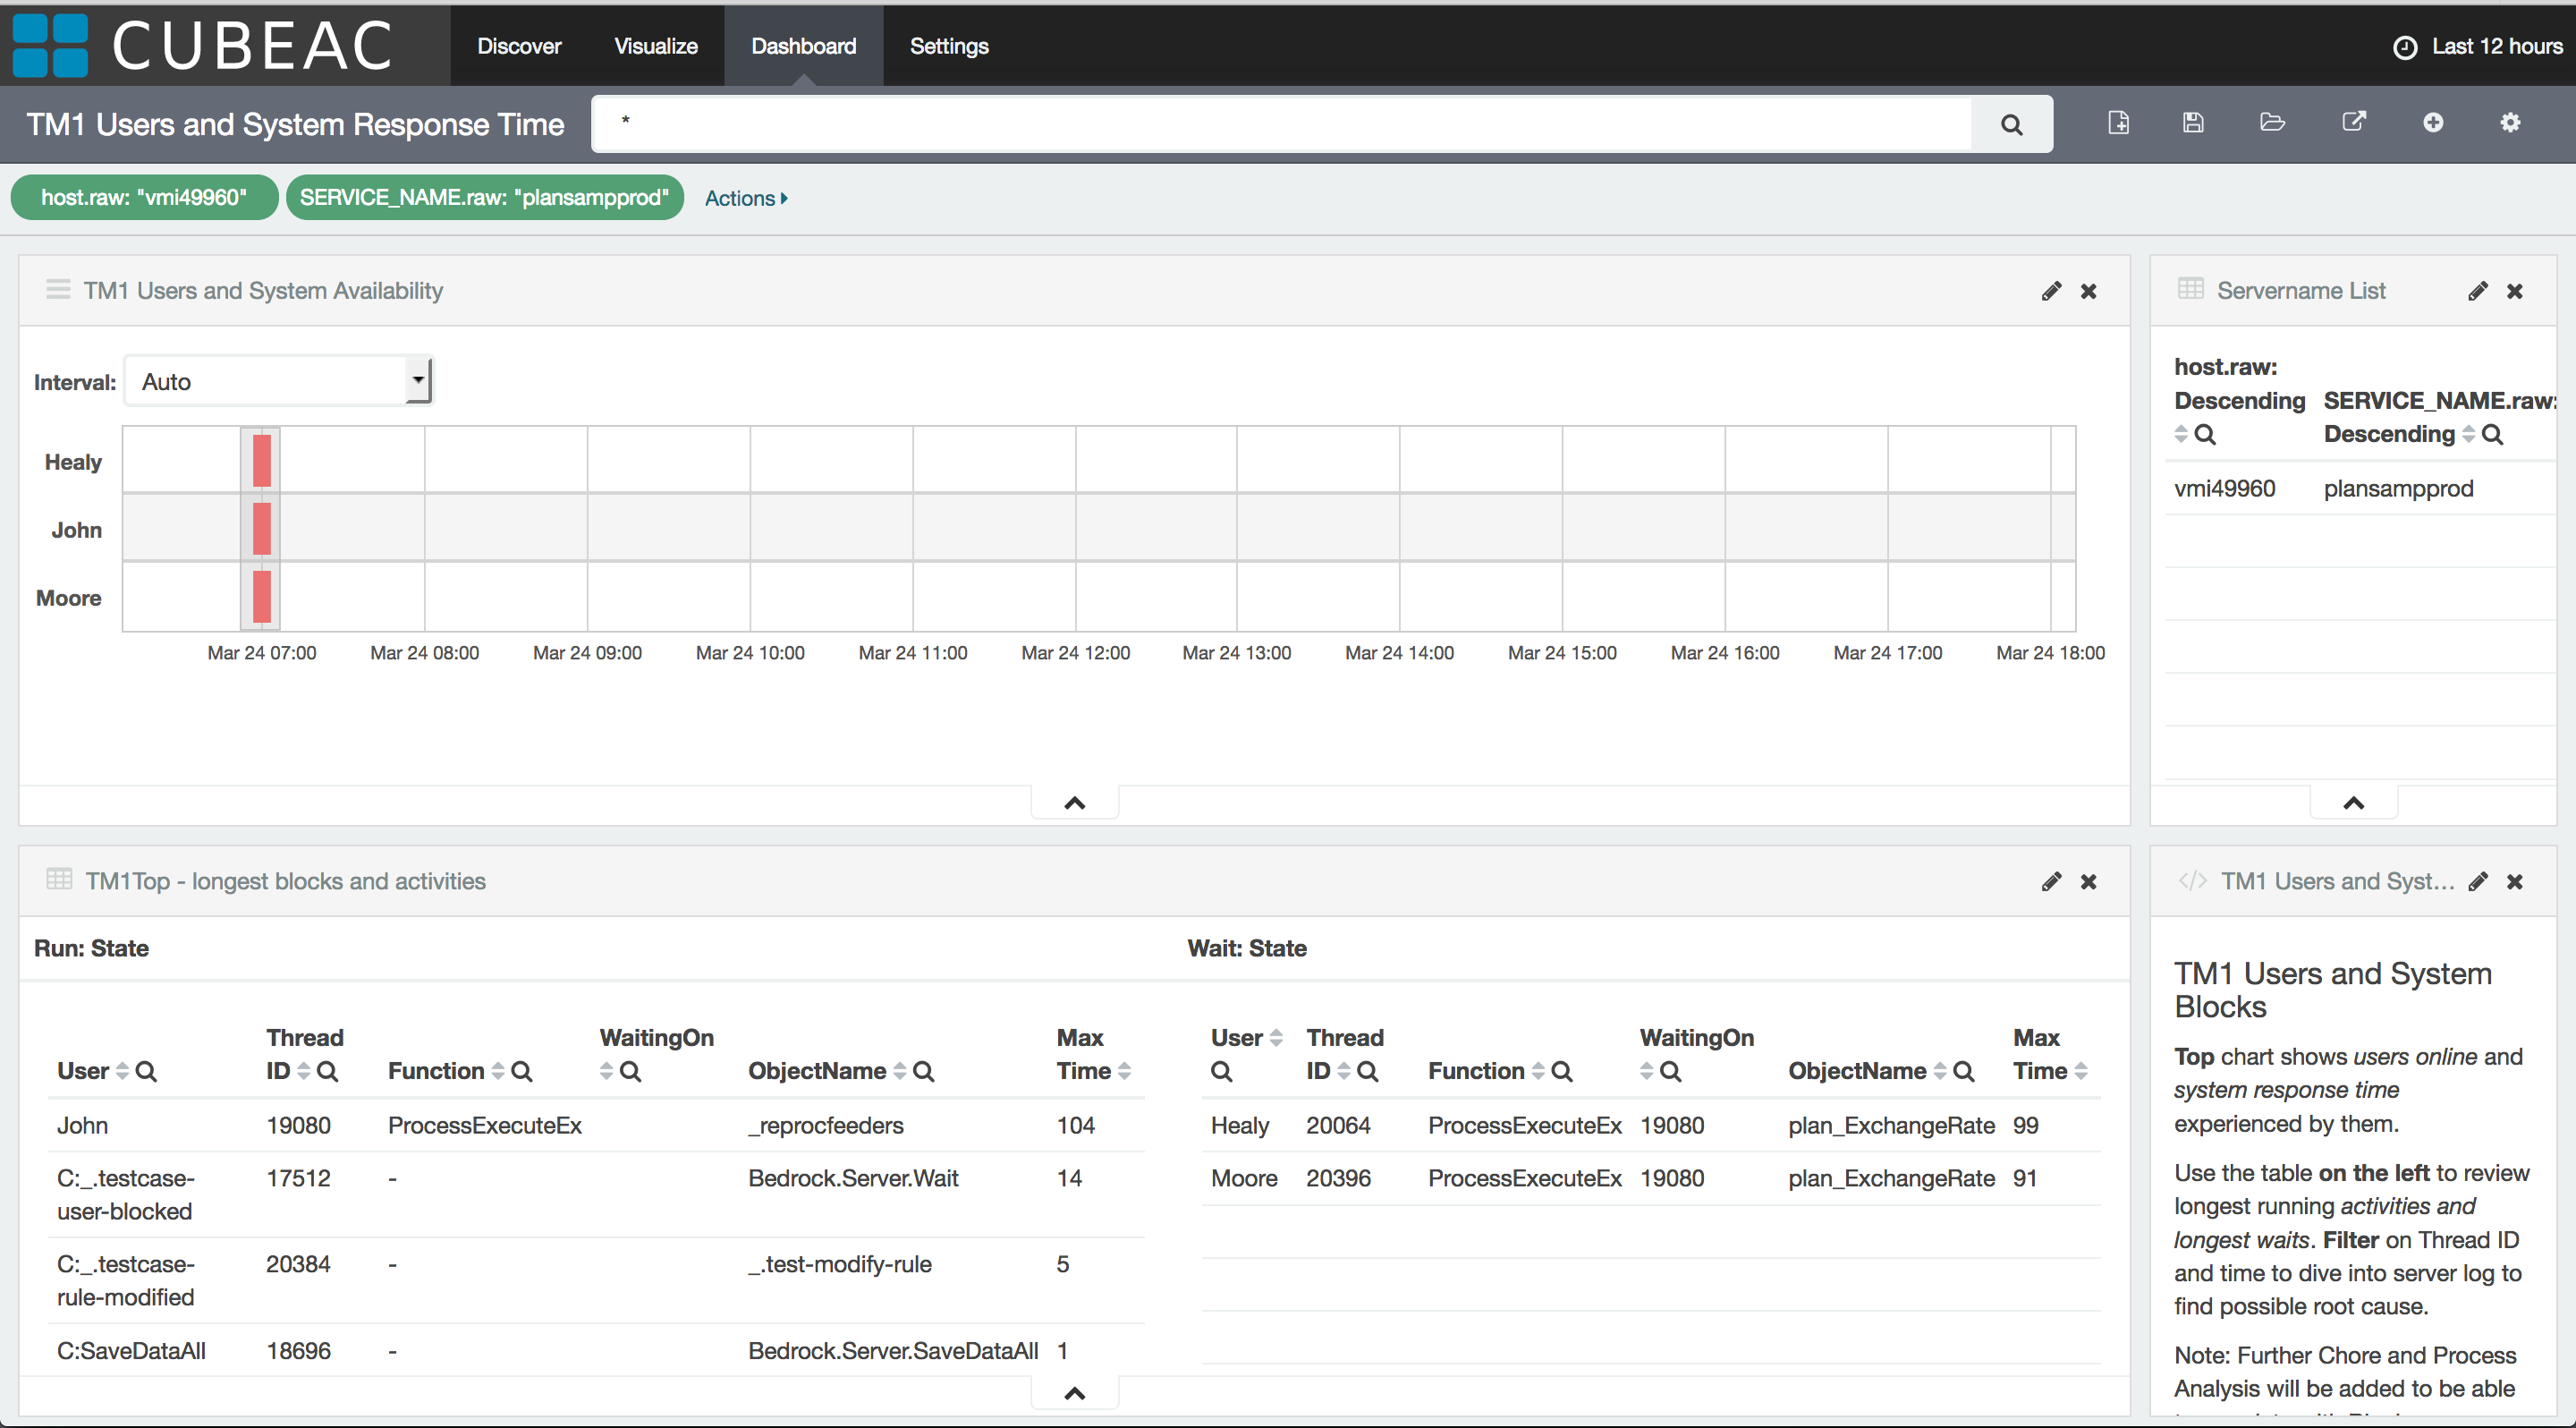
As Cubeac is a single place to monitor and manage your TM1 systems it’s worth to select the server you wish to review first - that’s the ‘Servername List’ on the top right. The default timeframe gives more of an overview so it’s worth to zoom in on particular blocks.
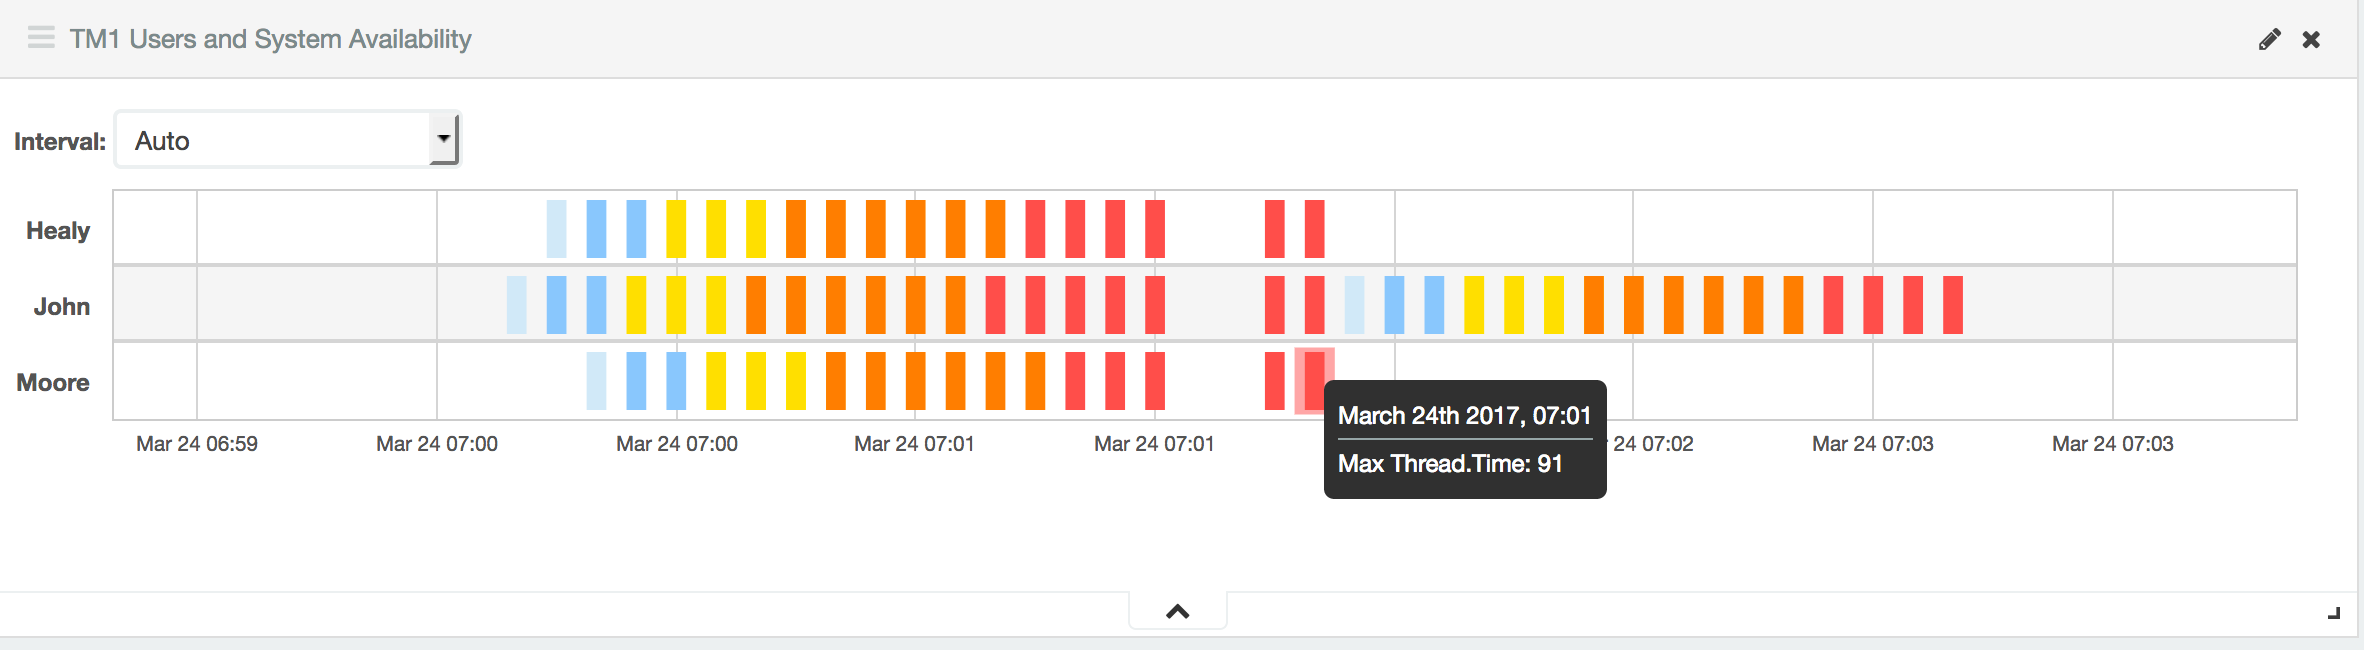
The top left chart shows user’s wait times, when they are blocked, color coded based on how long they’ve been waiting. Zooming in allows to focus on a relevant area, cutting out irrelevant parts.
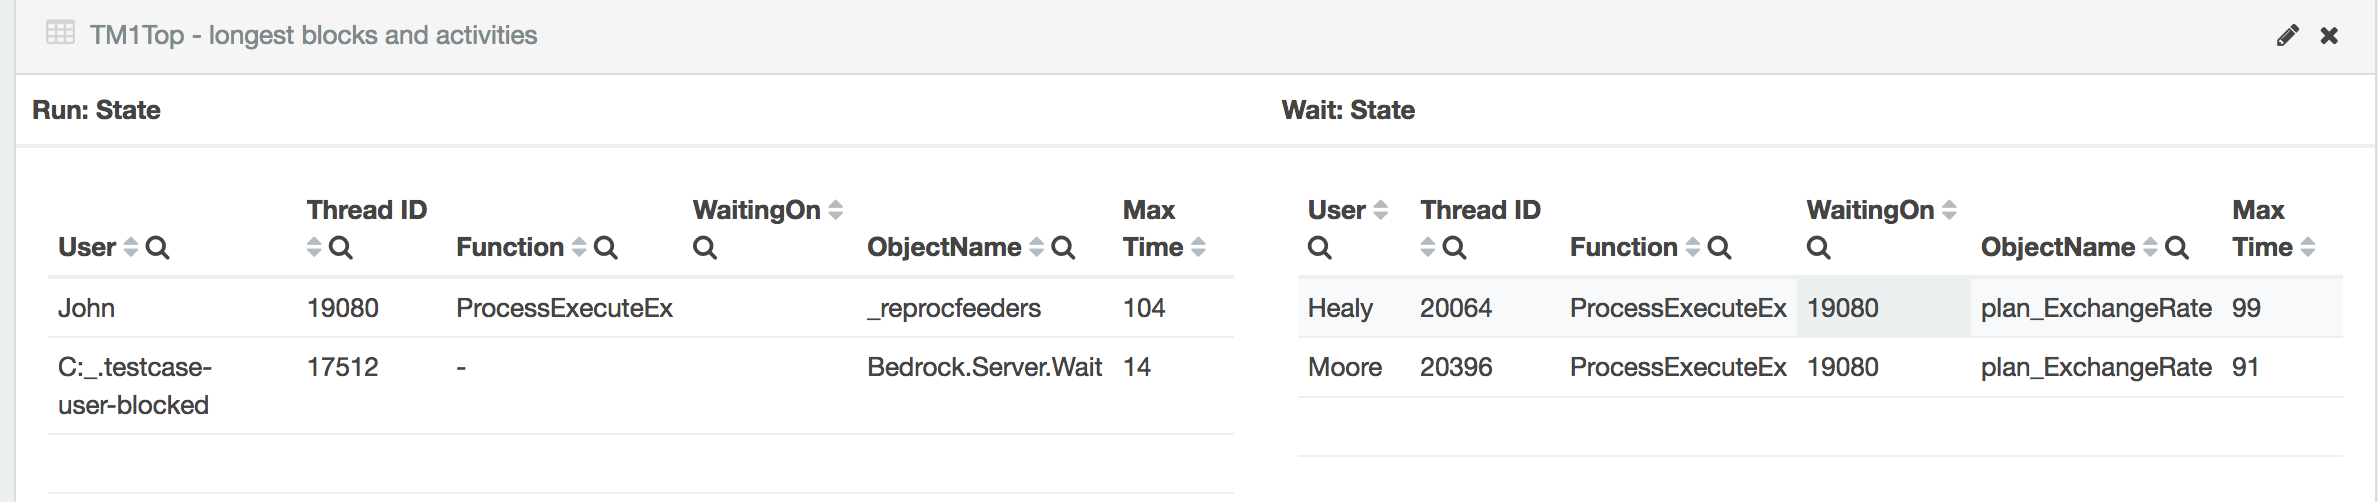
What we see on the main block is TM1Top information split by Thread State. Threads are the individual processing streams in TM1 and their state shows their status: Run is for carrying out an activity like running a process, retrieving a view or changing a rule. Wait stands for being blocked, waiting for other task (thread) to finish - the WaitingOn column shows which Thread exactly.
While this method will get you to the activity causing a lock it’s worth to get familiar with the locking system of TM1. Read our blog post Tips and Tricks: What is going on in your TM1 model?.
So once the culprit is identified one can filter on the specific Thread ID by clicking on it.
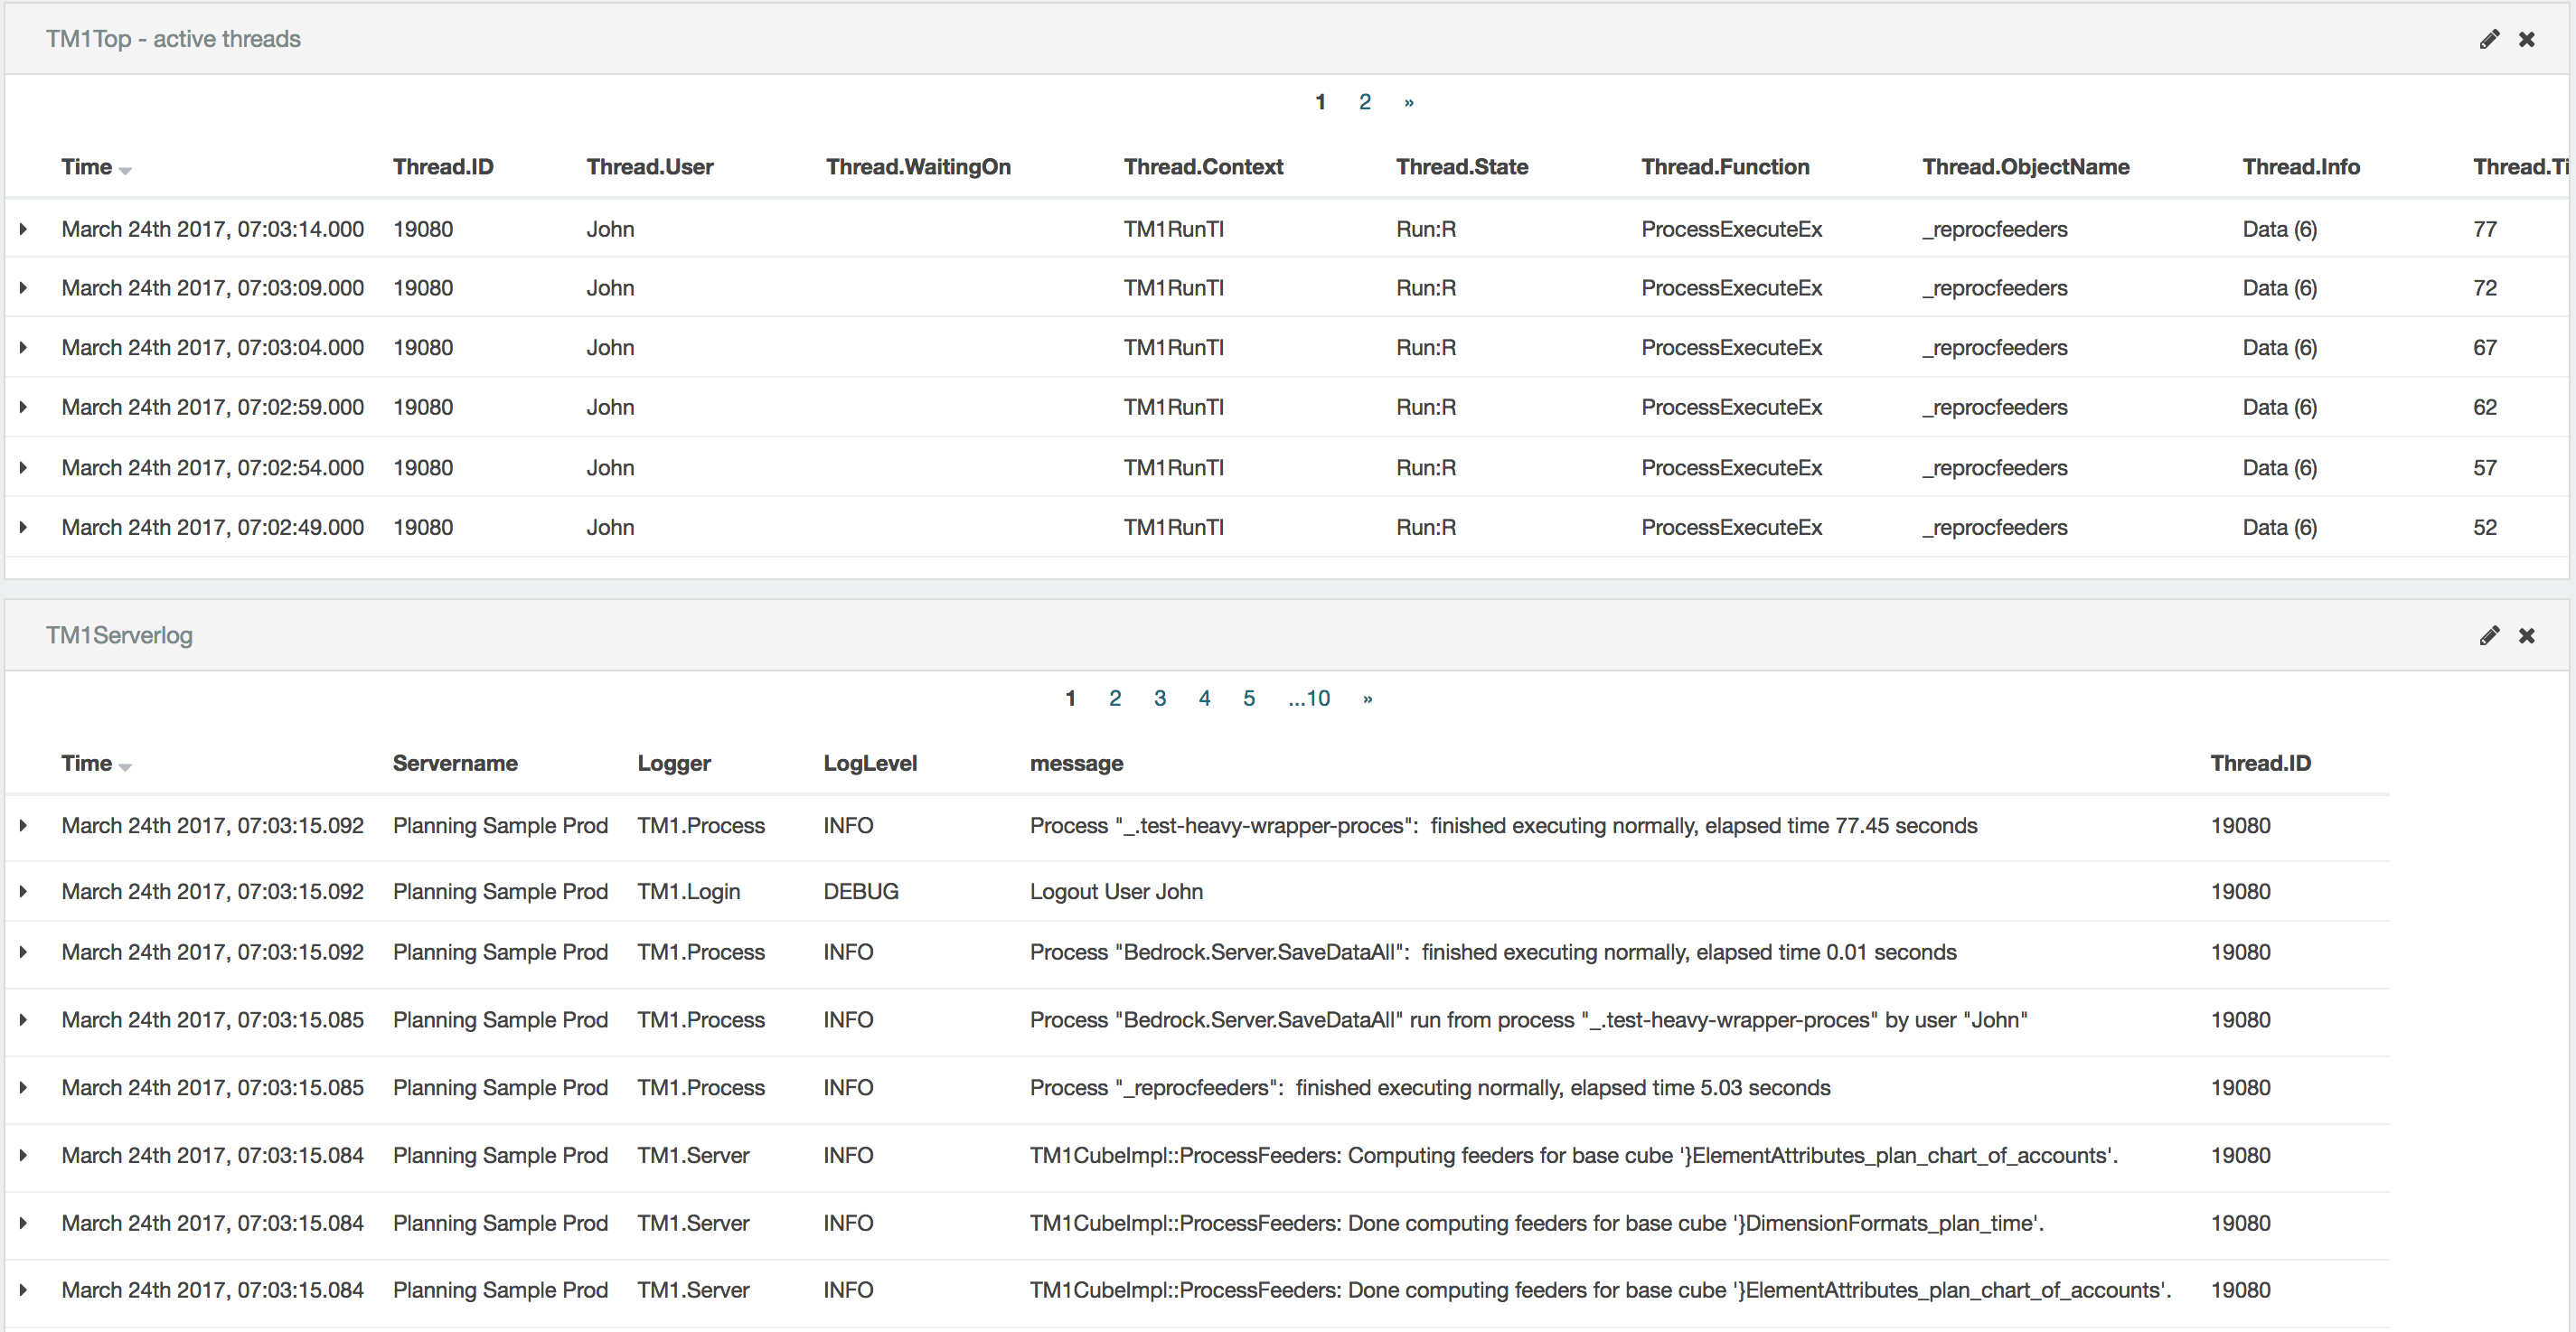
The next two blocks show a detailed history of the Thread and the related Serverlog - both indispensable for our analysis.
This is a very clear example, as most are familiar with the blocks caused by saving a rule file - effectively recalculating feeders. So what kind of actions can lock TM1 and cause users to queue up and wait? Some examples include:
- Dimension updates
- Rule save / feeder processing
- SaveData
- Security Refresh
- Dynamic subset calculation if the server is not configured to handle that properly
- Cube data updates if the server is not configured to handle that properly
- Establishing internal cube dependencies
Possible remedies:
If this is just a scheduled nightly chore one could just find better timing for it - the Chore Timeline visualisation of the Chores and Processes dashboard can be useful here. Users can also be notified of the standard maintenance windows where the system’s response time can be below average.
If this is not sufficient the specific flow should be analysed - the Doc module is a good starting point as it allows to filter by functions types - e.g. metadata updates.
If rescheduling is not sufficient various approaches exist, like splitting the tasks, re-engineering processes or changing how they are executed.
When talking strictly about TM1 server performance the two key topics to be reviewed here are:
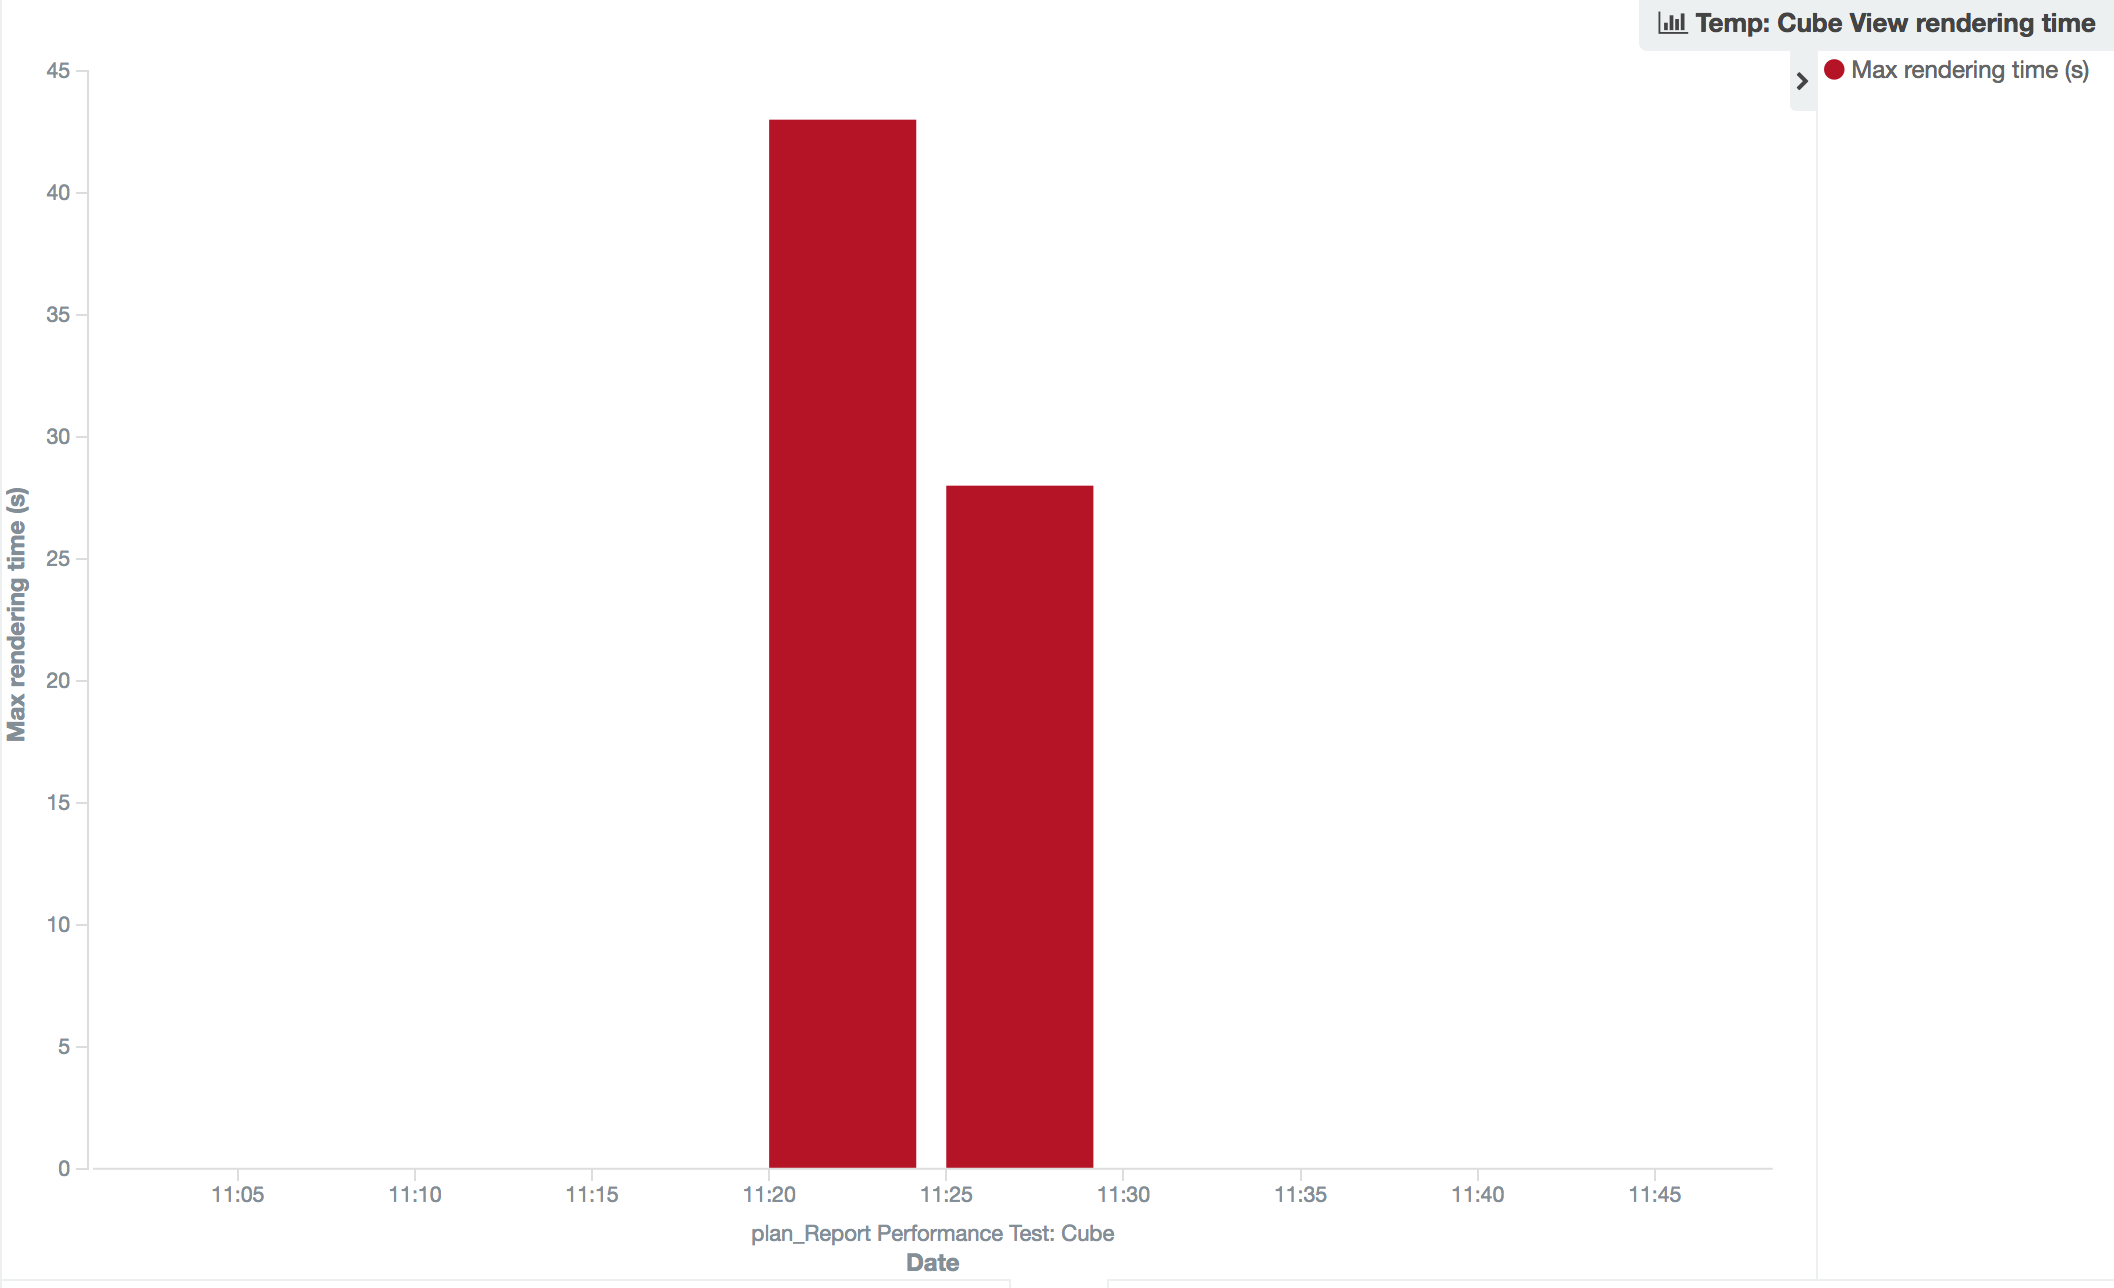
Cube performance - how long does it take to retrieve a Cube View (Report)?
Again the information in Cubeac can help answer these questions, visually - an example chart here showing average Cube view retrieval time:
Process performance - how long does it take to execute data transfer, e.g. doing a data load or an export?
Chores and Processes have their custom analytics in Cubeac, each run is recorded thus it’s easy to do a timeline analysis for average / maximum run times.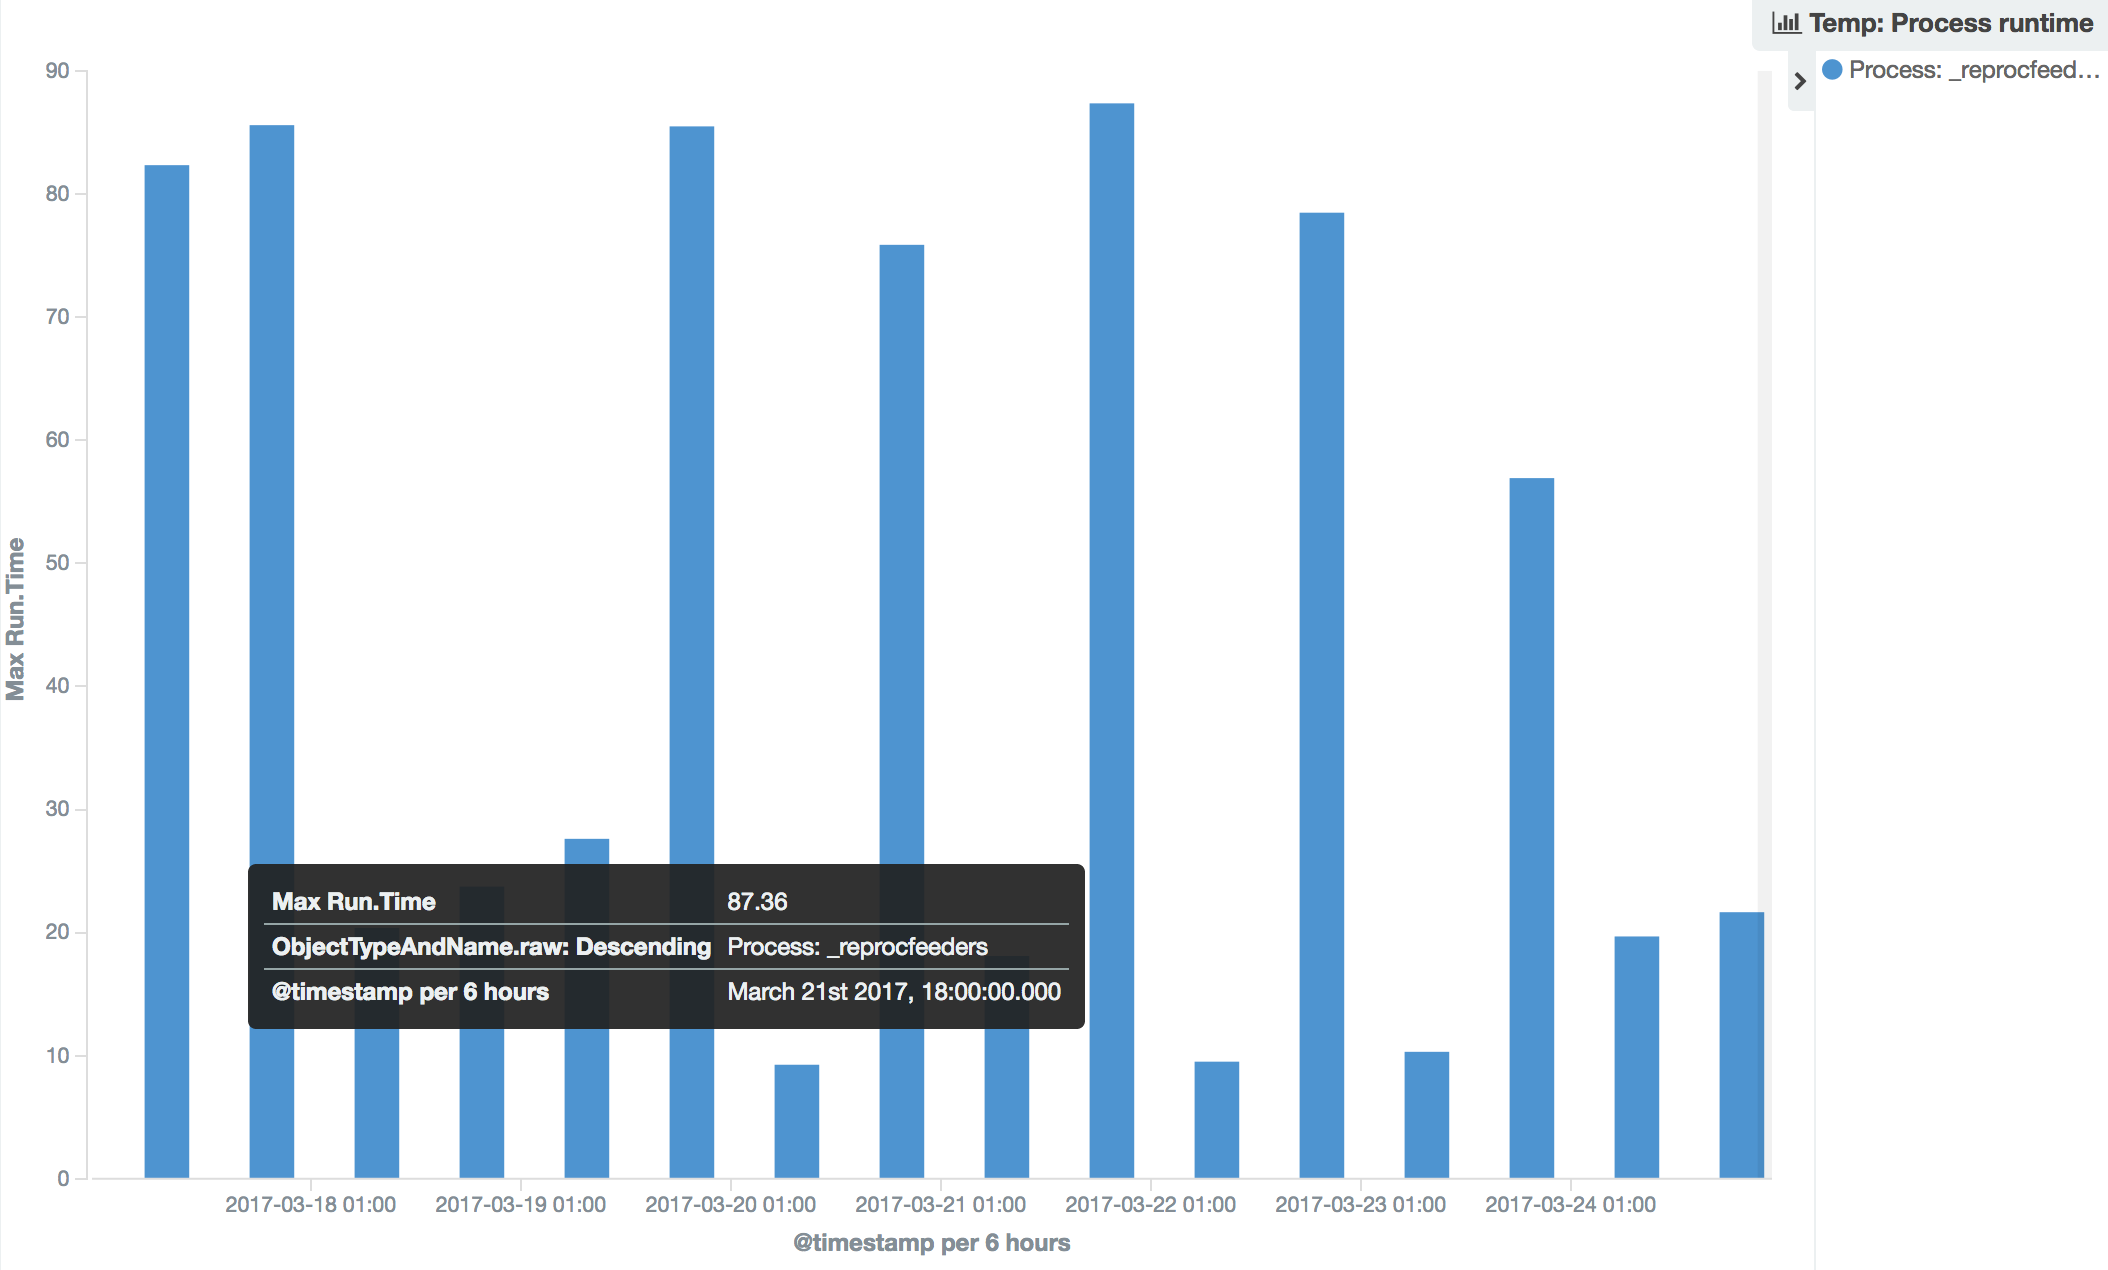
Cubeac provides you easy-to-use standard tools to replay any event and review performance issues. When you need to go deeper you can, as all raw system data collected by Cubeac is available to you, analysable by the built-in visualization and dashboard tools.